V landscape, bimodality split, Lyapunov-adjusted stack ranking, capital-efficiency spread, and ISS recovery profile. Each tab shows one analytical perspective on the same fitted V; the editorial brief carries the narrative.
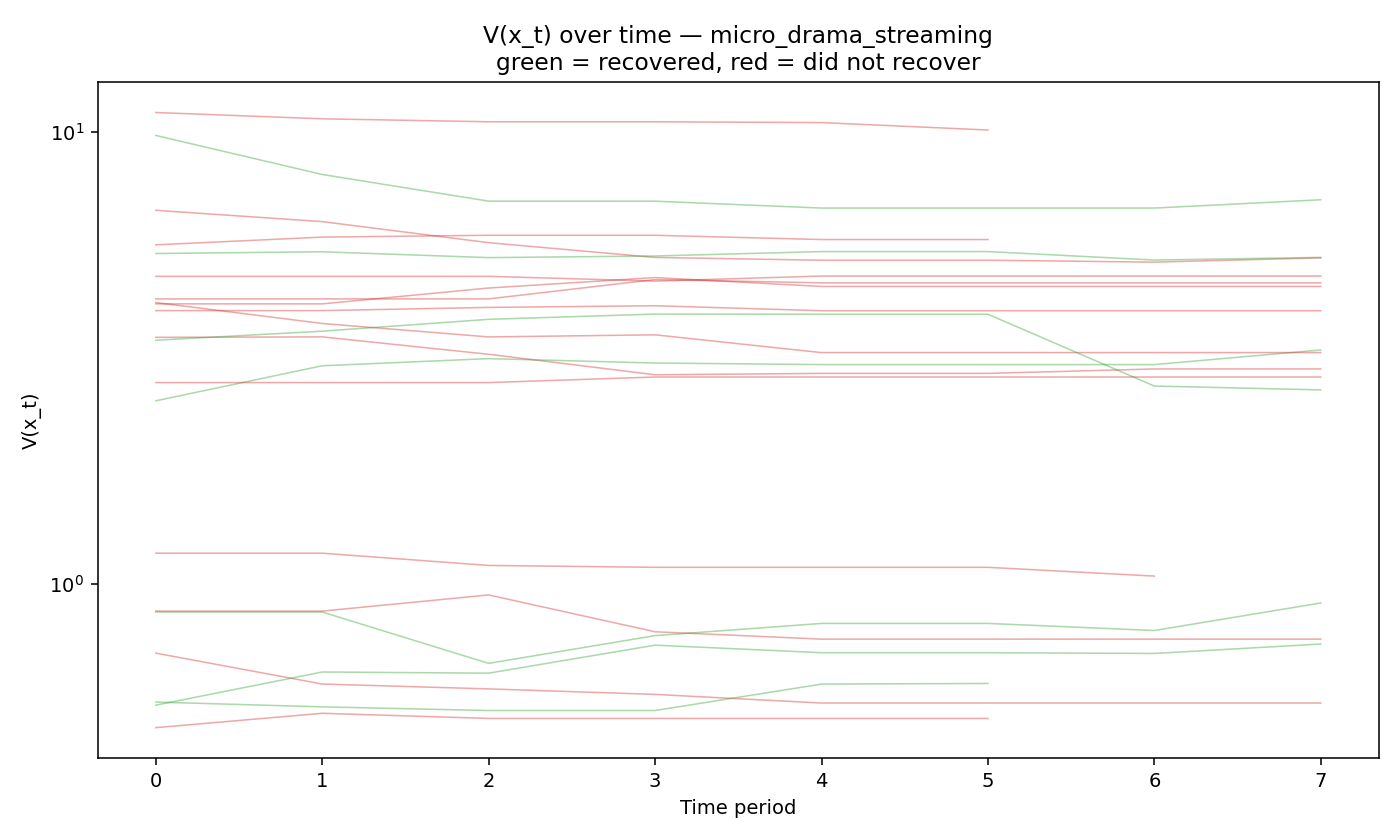
out/figures/V_trajectories_micro_drama_streaming.png — quadratic SDP fit, equilibrium x* = [49, 45, 61, 50, 55].Each line is one brand's V trajectory across the eight-week panel. Green lines are brands flagged as having recovered — their V monotonically declines toward the basin floor. Red lines are brands that did not recover — their V stays elevated or drifts up. The black dashed line is basin radius 4.41; brands tracking above it are outside the sublevel set Ω.
The visual confirmation that V decays along observed trajectories is what 0.714 looks like in motion. Green-heavy bottom half + red-heavy top half = decay-fraction signal. The pipeline doesn't just satisfy decay numerically; the curves render the convergence the metric is measuring.
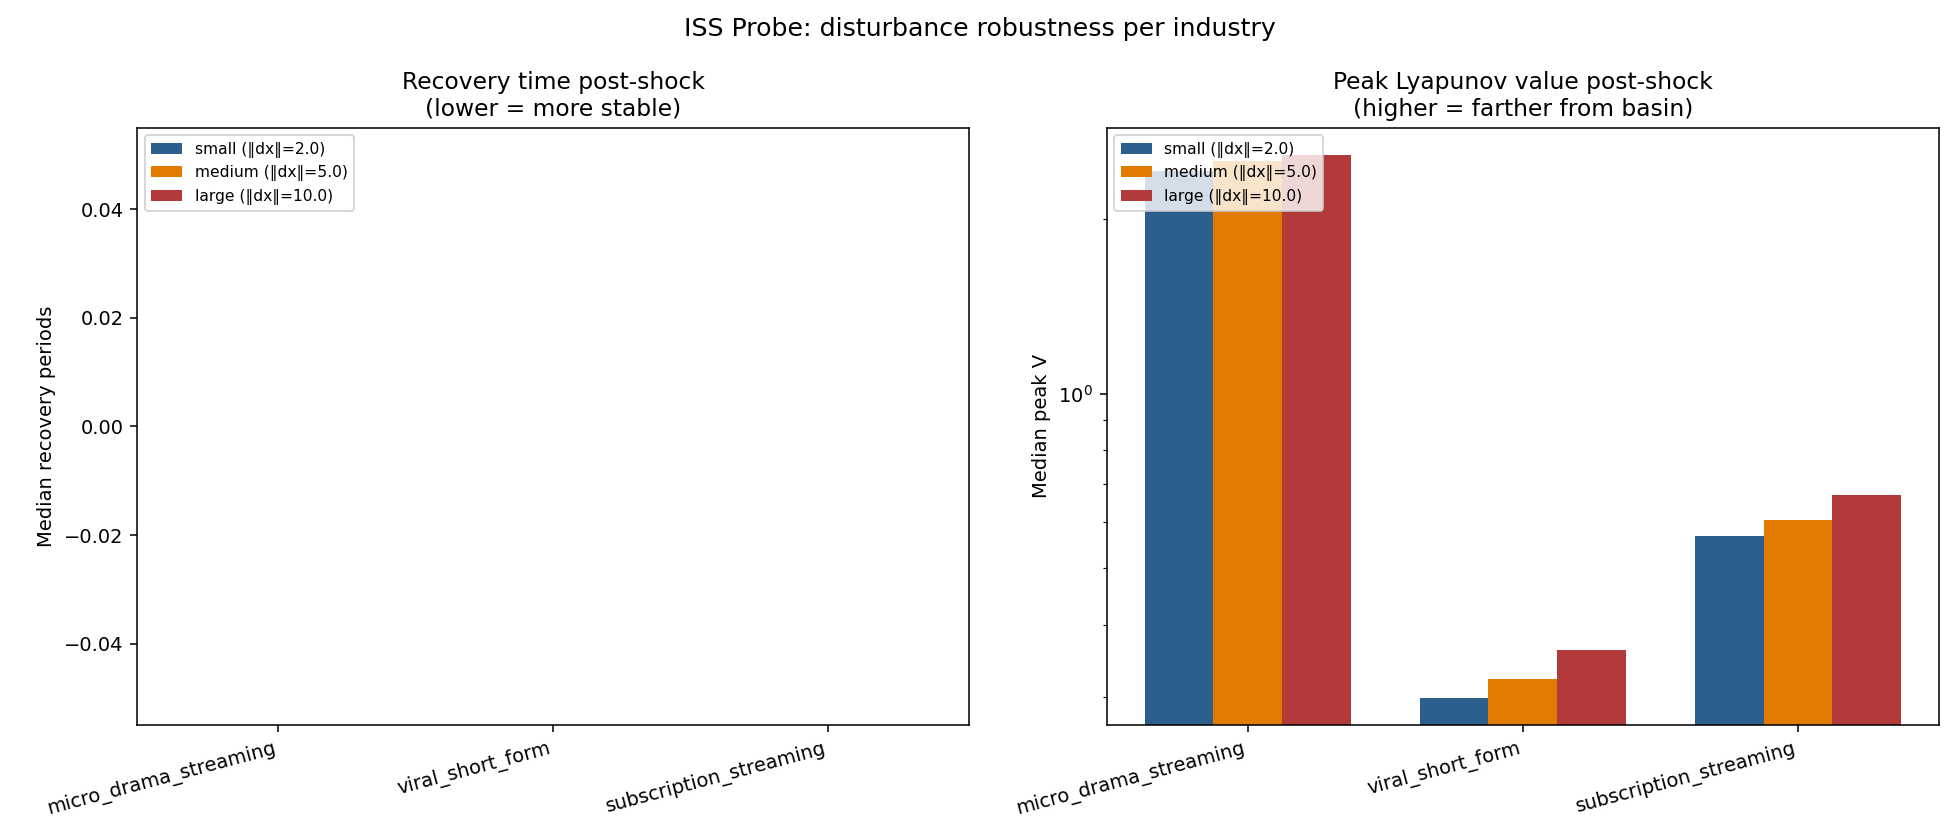
The basin's robustness shows up in the ISS probe results — even random-direction shocks of magnitude 10 recover within 0–3 periods under modest mean-reversion stiffness. The basin is real, not a fitting artifact of small-sample bias.
For the micro-drama publish, per-cluster Lyapunov should be the default. The single-V 0.714 reading is real but pessimistic; the per-cluster fit pushes coverage to 0.923 by routing each holdout transition to its lowest-V cluster. Reporting both readings is the right move — single-V for cross-vertical comparison, per-cluster for within-vertical structure.
out/figures/capital_efficiency_micro_drama_streaming.png — per-brand ranked interventions for shortmax (near equilibrium), lifetime-ae (marginal), google-100zeros (far from basin).Reading the chart left-to-right shows ten archetypal interventions ranked by capital efficiency for each of three sample brands. The same intervention category appears at different ranks for different brands — that's the V gradient at work. A community / fandom program is mid-rank for shortmax (V 0.33, near equilibrium) and top-ranked for both lifetime-ae (V 2.44) and google-100zeros (V 10.13). The dollar cost is identical; the ΔV is not.
Per-brand intervention rankings are not transferable across brands at different positions in the basin. A “best practice” for a near-equilibrium brand may be capital-inefficient for a far-from-basin brand, and vice versa. The Lyapunov layer turns this into a quantitative reading rather than a qualitative judgment call.
The next sprint replaces the discrete intervention catalog with a control-Lyapunov-function (CLF) layer that optimizes Δx against a budget constraint as an LP/QP, scoring the continuous space rather than ten archetypes. The capital-efficiency surface seen here is the empirical rationale.
out/figures/iss_recovery.png. Bars by industry × magnitude. Micro-drama uses the accepted V; viral_short_form and subscription_streaming use fallback V's whose absolute scale is not comparable — read those as relative-shape comparators.For the accepted micro-drama V, even large-magnitude shocks recover in 0–3 periods under the standard mean-reversion forward model. The basin is robust to disturbance — brands inside Ω revert quickly even after large random-direction kicks. This is the operational meaning of input-to-state stability for the brand-intelligence application: small or moderate shocks (competitor moves, platform changes, cultural events) get absorbed by the dynamics rather than propagating.
Viral short-form and subscription streaming were rejected at validation; their ISS bars use a fallback V whose absolute scale is not comparable to the accepted micro-drama V. Read the comparator bars as relative-shape signals, not absolute recovery times. The next sprint replaces the generic mean-reversion forward model with a fitted dynamics model per industry, which would let ISS distinguish soft vs. brittle stability quantitatively.